FINAL REPORT
11.S953 Workshop on City Form, in collaboration with Sidewalk Labs
Yueheng Lu, May 24 2020
The Importance of Walkability
Before the mass production of bicycle and cars, walking has been the most common way of travel. Since the great economic expansion after World War II, automobiles have become the dominant mode of travel in cities. The impacts of the rise of cars are visible both in urban forms and behavioral changes of people. Issues including automobile exhaust, danger of walking in empty streets (lack of "eye on the street"), growing population with diabetes and obesity, etc are considered as consequences of auto-oriented planning. Therefore, recently walkable designs become more and more favorable to both planners and the public.
Defined as a measure of how accessible the district / neighborhood is to pedestrians, walkability has health, environmental, and economic benefits. Researches have shown that there is a correlation between Body Mass Index (BMI) and physical activities , which can prevent many chronic diseases. Thus, neighborhoods that encourage walking are believed to be good for public health. Environmentally, the more walkable the city is, the less car exhaust there is. A walkable street or neighborhood with active pedestrian flow would come with commercial activities and economic growth.
Definition of KPI
The Walkability KPI is defined as an index of pedestrian accessibility. More specifically, it seeks to model human's potential of walking trips in the measured region by considering how many the destinations are and how the accesses reach them by walking are.
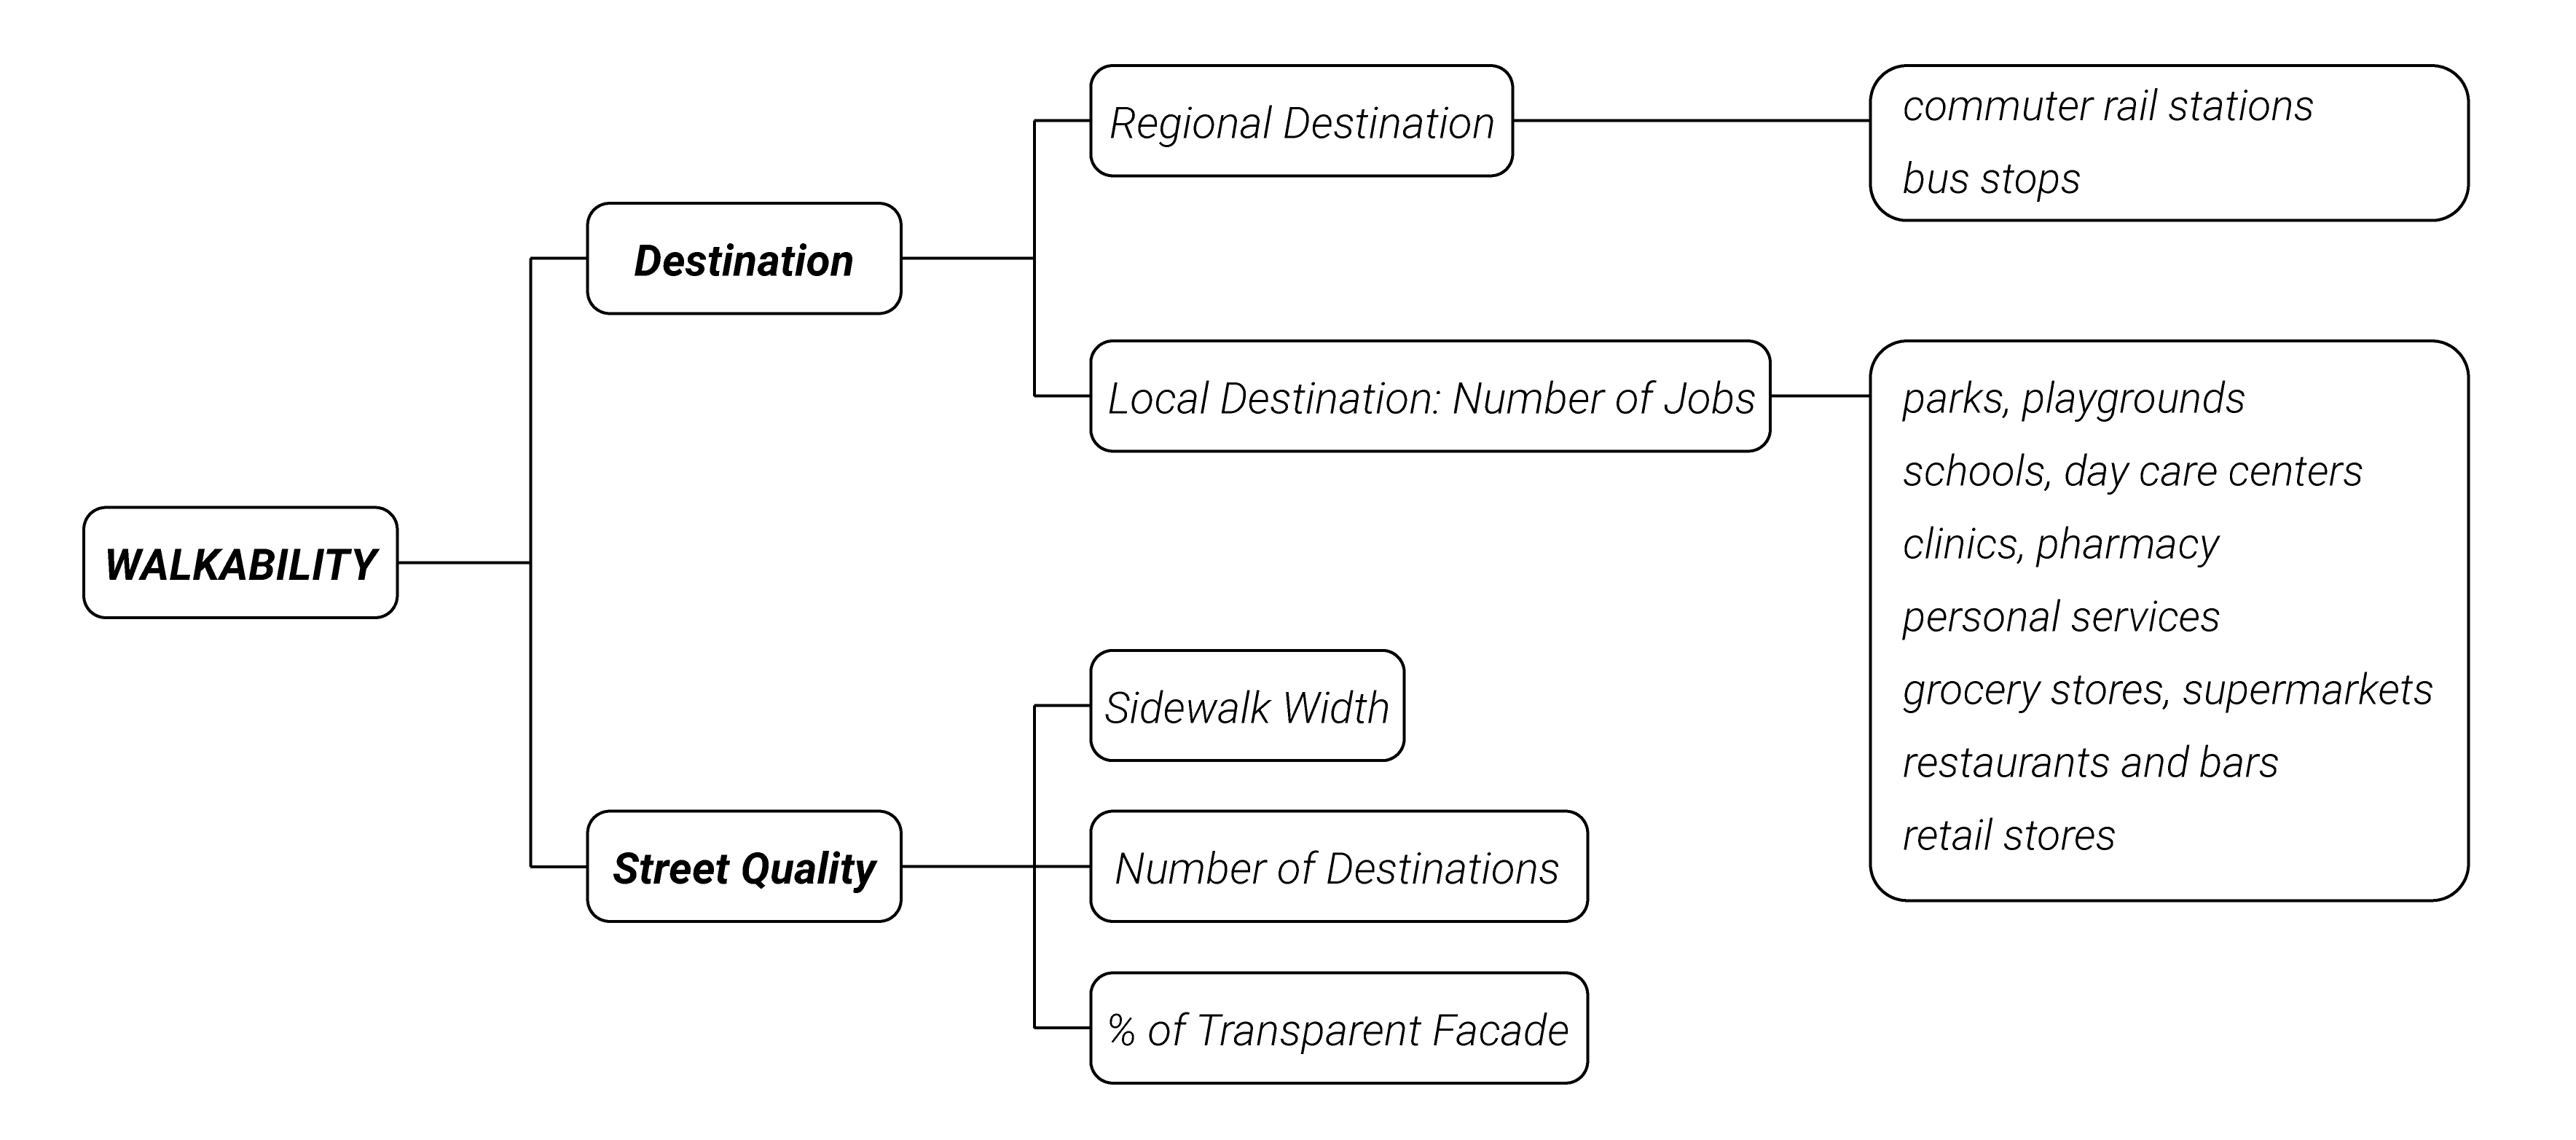
Destination
According to researches on critical environmental factors on walkability (Boarnet et al., 2011; Cervero, 1996; Cervero and Duncan, 2003; Guo, 2009), the quantity of pedestrian trips is related to the number of destinations available in the neighborhood; and the probability of trips decreases as the distance required to walk increases. In this research, pedestrian destinations include both regional destinations (i.e. transit stops) and local destinations (i.e. grocery, retail stores, parks, etc.) to capture behaviors for an average person.
Street Quality
The quality of streets would greatly influence the pleasantness of walking (Speck, 2013). Many researches have been devoted to the measurements of walking experience. According to Ewing and Handy in the article "Measuring the Unmeasurable: Urban Design Qualities Related to Walkability ", five categories of factors will count for walking experience level, including imageability, enclosure, human scale, transparency and complexity. A good sidewalk consists of decent width for walking, smooth surface, some storefront activities, setback of buildings, greenery, street furniture, sufficient lighting condition, etc. Due to the accessibility of data, three of the most representative factors are chosen in this research but it is easy to include a larger set of factors into the algorithm below.
Methodology
The calculation of Walkability KPI uses a modified gravity model to measure pedestrian accessibility from residential buildings to target destinations within a 15-min desired walk shed (i.e. 1300 meters). Compared to standard gravity model, it takes two additional factors into account: the attractiveness of destination approximated by the number of jobs at each location and the average street quality (SQ) from origin to destination.
Basic Formula
For each origin (i.e. each building), a walkability index can be calculated based on the following formula:
where is the importance weight assigned for each destination category; is the attractiveness weight of approximated by the number of jobs at each destination; and are the average street quality (SQ) and walking distance between the origin and the destination, respectively; and is the constant that controls how quickly the exponential decay happens as distance increases for each destination category, we use for this research.
Destination
Regional destinations:
- commuter rail stations -
- bus stops -
Local destinations, with , :
- parks, playgrounds
- schools, day cares
- clinics, pharmacy
- personal services
- grocery stores, supermarkets
- restaurants and bars
- retail stores
Street Quality
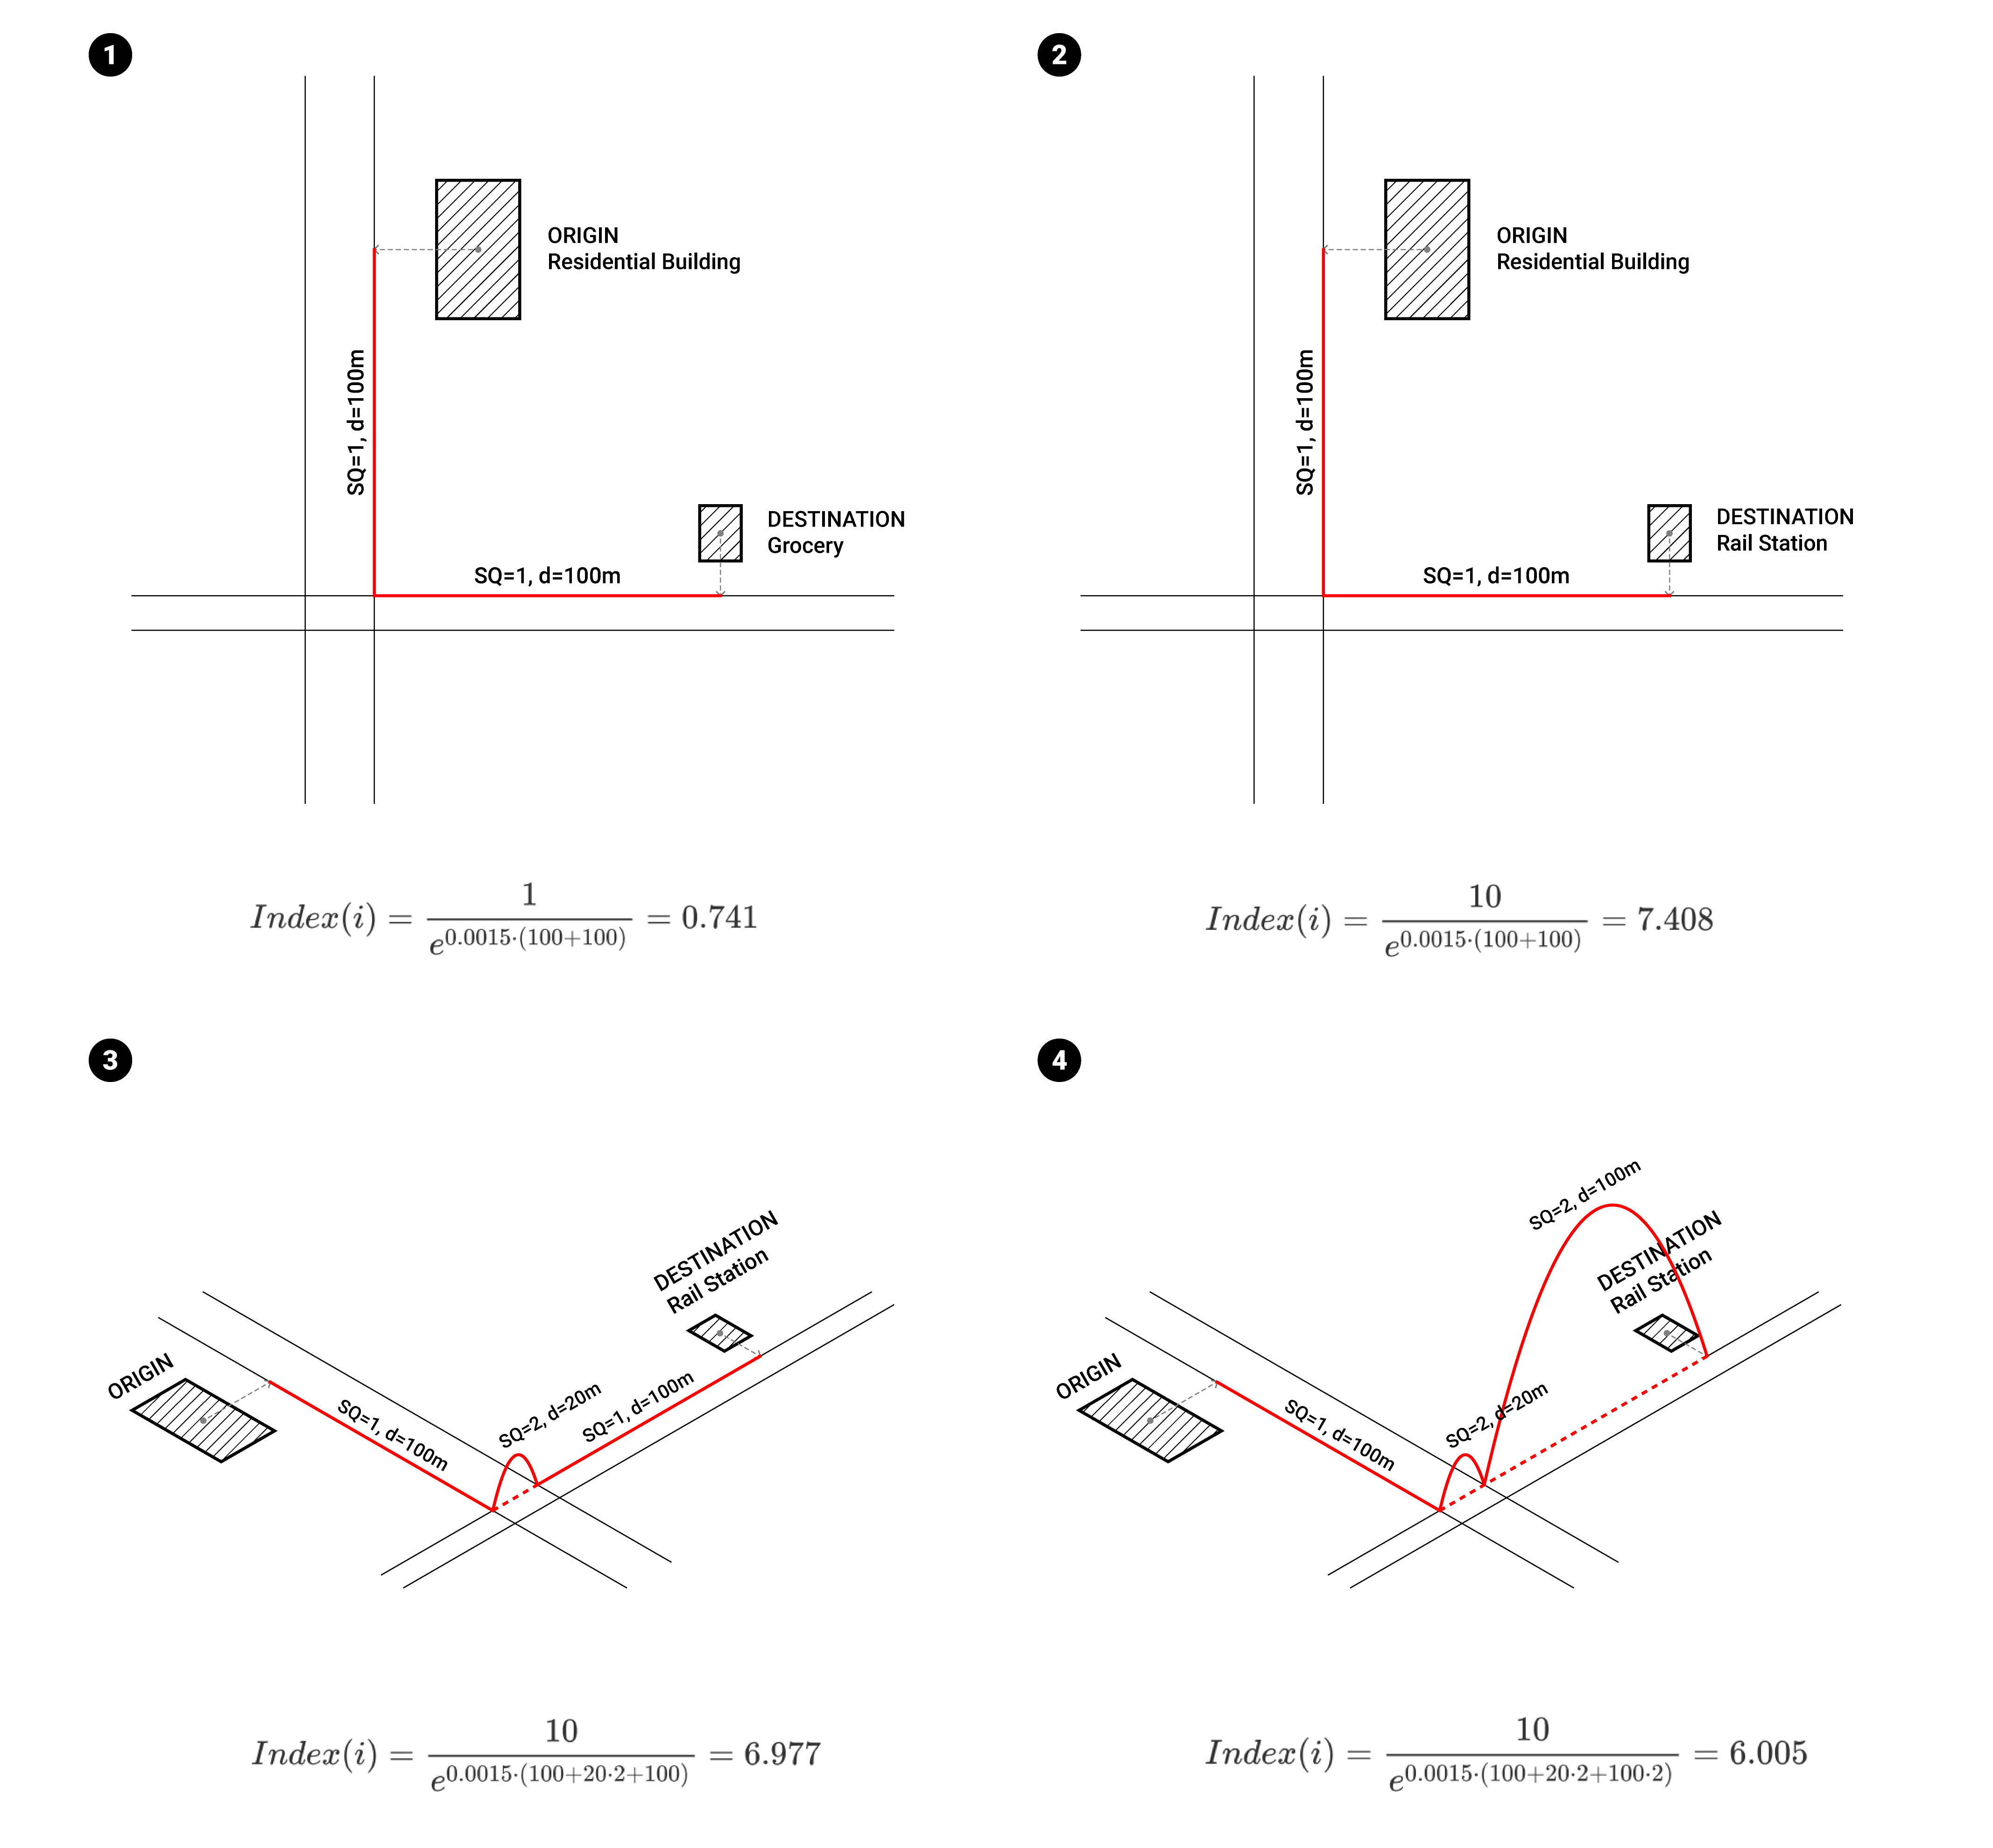
In the gravity model, all the factors of street quality are translated into adjustments to the walking distance between origin and destination. Good streets will not affect the walking distance, i.e. . Streets with uneven surface or narrow sidewalks will seem longer than the physical distance thus lowering the potential of walking trips, i.e. .
The measurements of street quality for each segment consider three aspects, which in the end will arrive at an :
- width of sidewalk—same side of street
- number of destinations—both side of street
- proportion of first floor street wall with transparency—same side of street
Specifically, crossings are considered as here since it involves intersection with other modes of traffic and waiting time.
The final for each origin-destination pair is the average street quality (SQ) along the shortest path between the start and end point.
Aggregation of Index
- First, take each residential building in the measured region as origin, and calculate based on basic formula. Below are examples of a single origin-destination pair calculation. Example 1 and 2 demonstrate the emphasis on commuter rail station in this research. Example 3 and 4 show that poor SQ will lower the index.
- Take the average as Walkability KPI for the measured area. Here, origins are usually from the area with proposed interventions and destinations are within 15-min walking distance but not necessarily within the proposed area.
Implementation
Baseline Implementation for Seven Scenarios
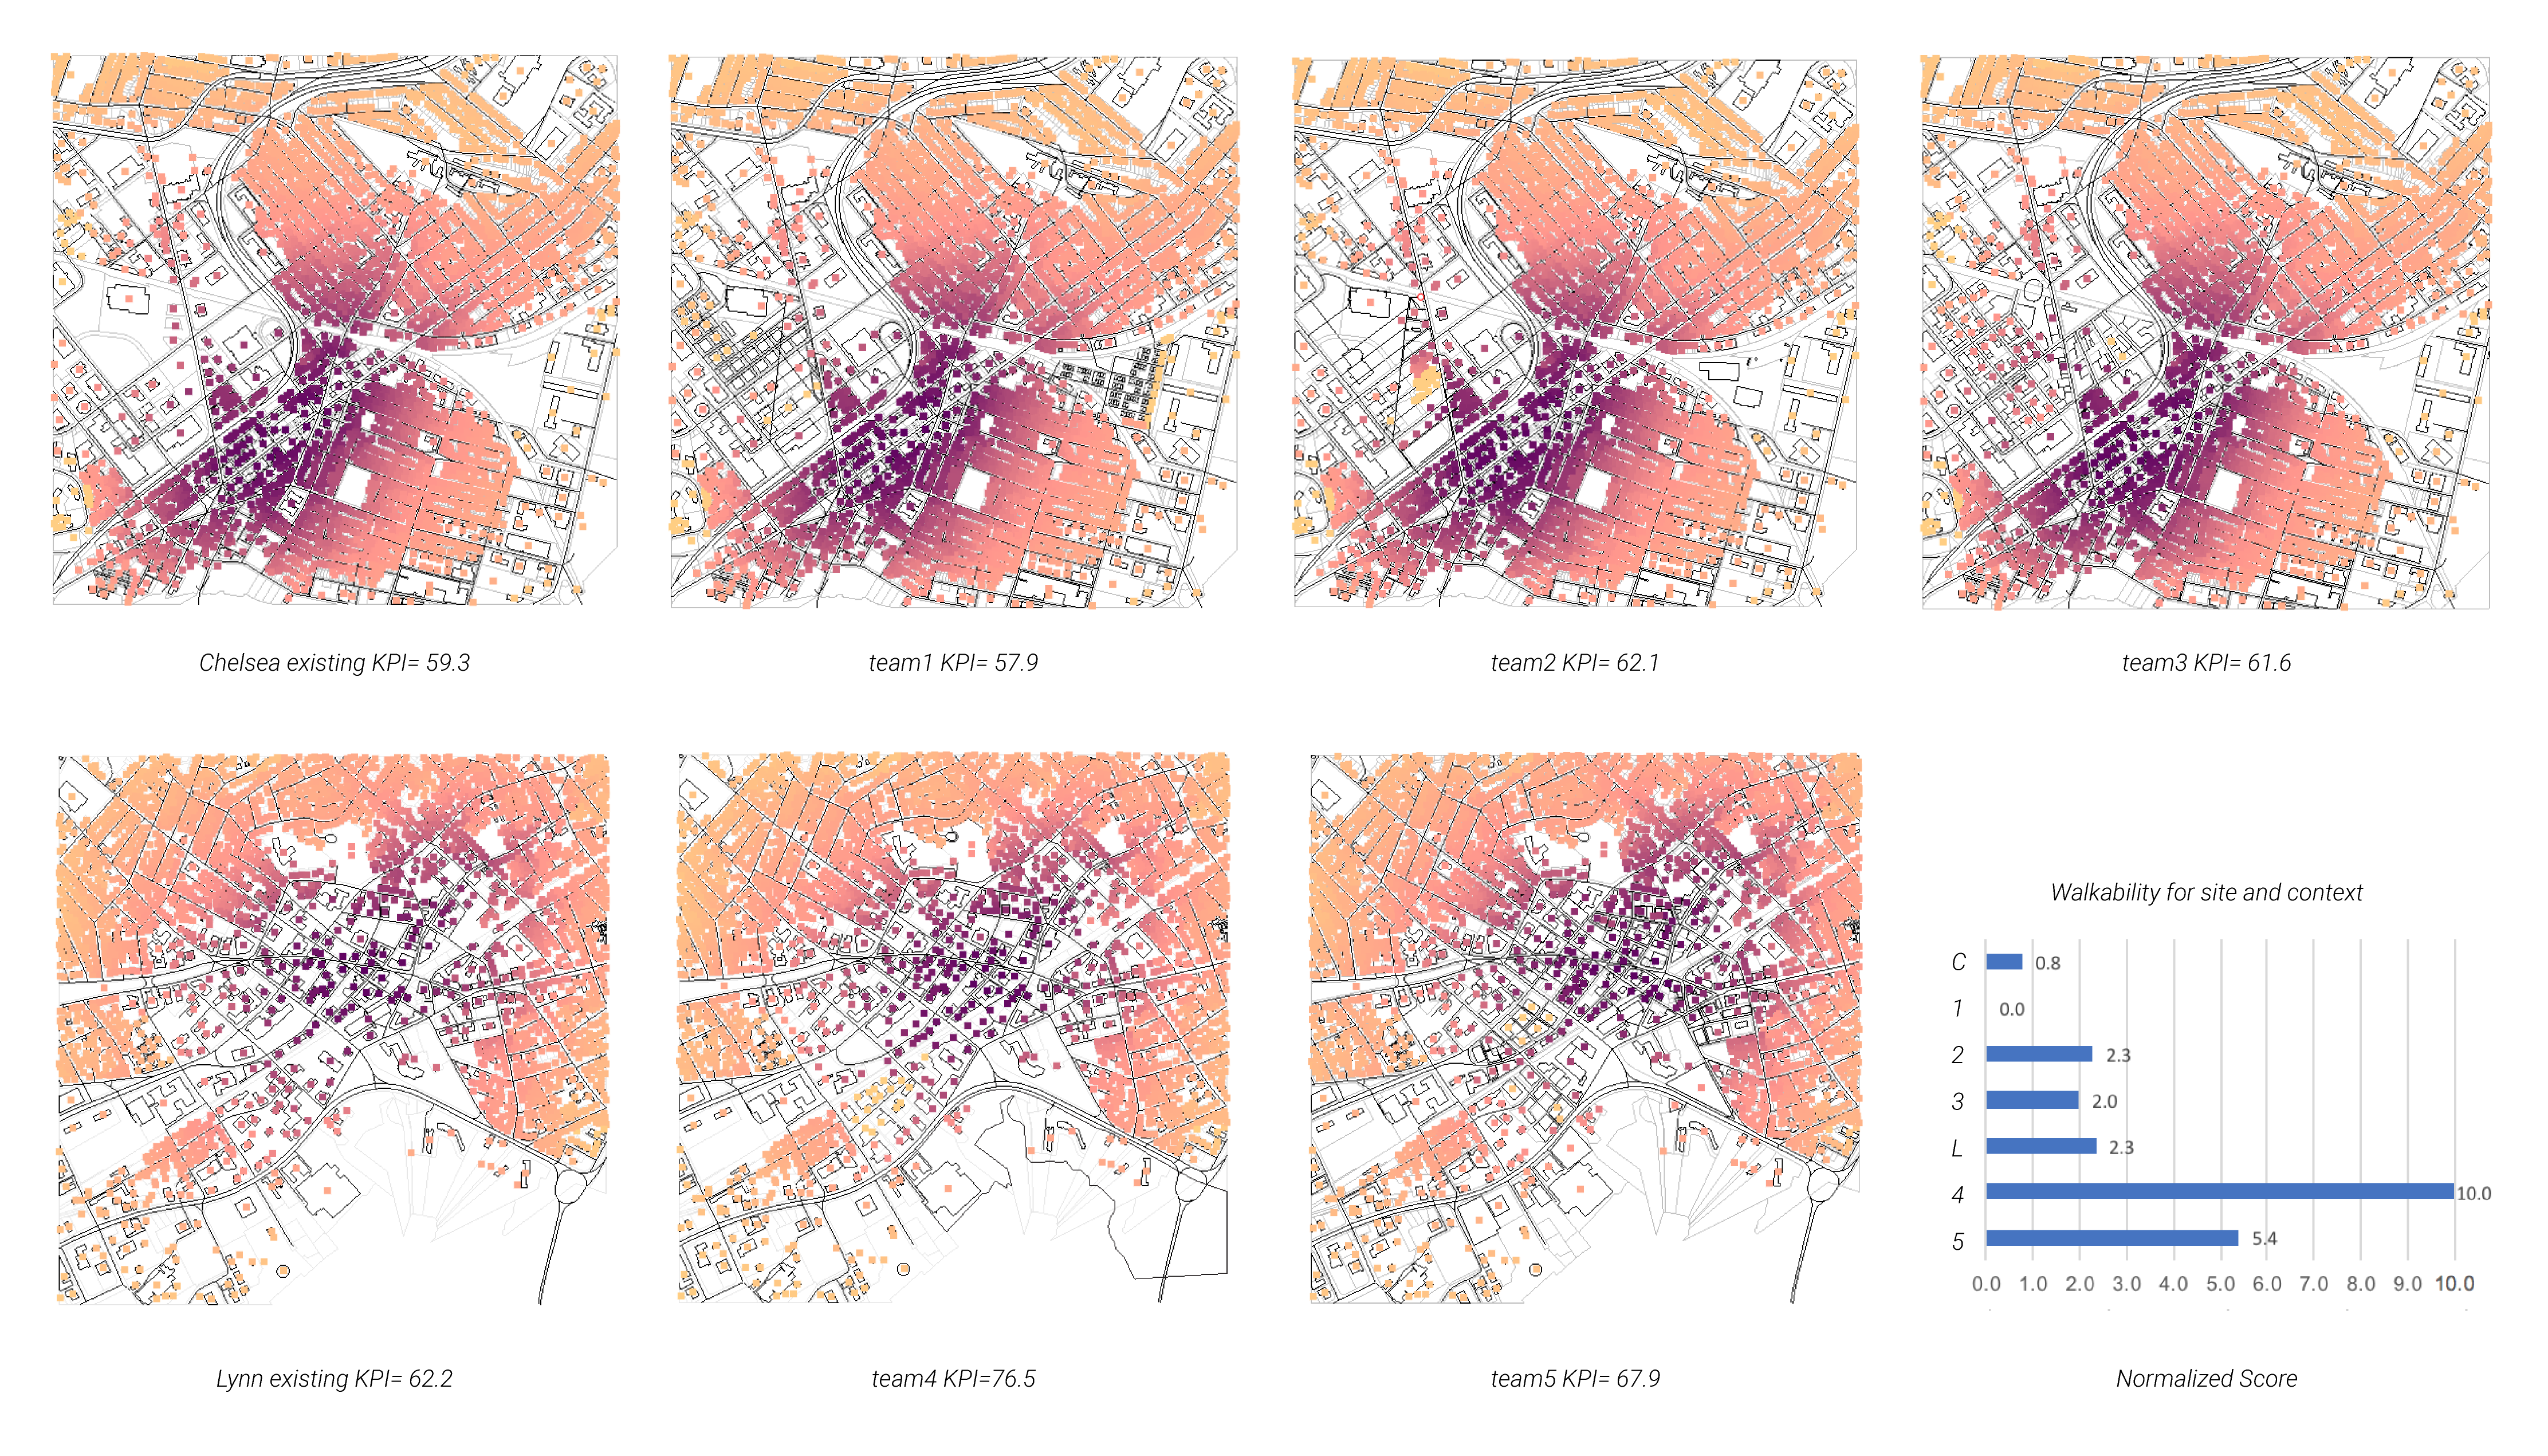
The Implemention for two existing condition and five proposal in Chelsea and Lynn used residential buildings in the whole site. The weights for importance and attractiveness and street quality were not adjusted, i.e. . Due to the averaging of all residential buildings' score, the final Walkability KPI didn't vary much between scenarios.
Strategies for KPI Improvement
Since Walkability KPI really relies on closeness to target destinations and street quality. First strategy to approach KPI improvement would be adding more destinations closer to the origins (i.e. residential buildings). Second strategy might be adding more pedestrian-only streets so that destinations could become closer. In the cases of Chelsea and Lynn we used , however, can be modified if the group of people we are modeling changed. Therefore, the third strategy could be targeting certain groups of people in housing design. Senior citizens will have higher ; younger population will have lower , thus higher KPI.
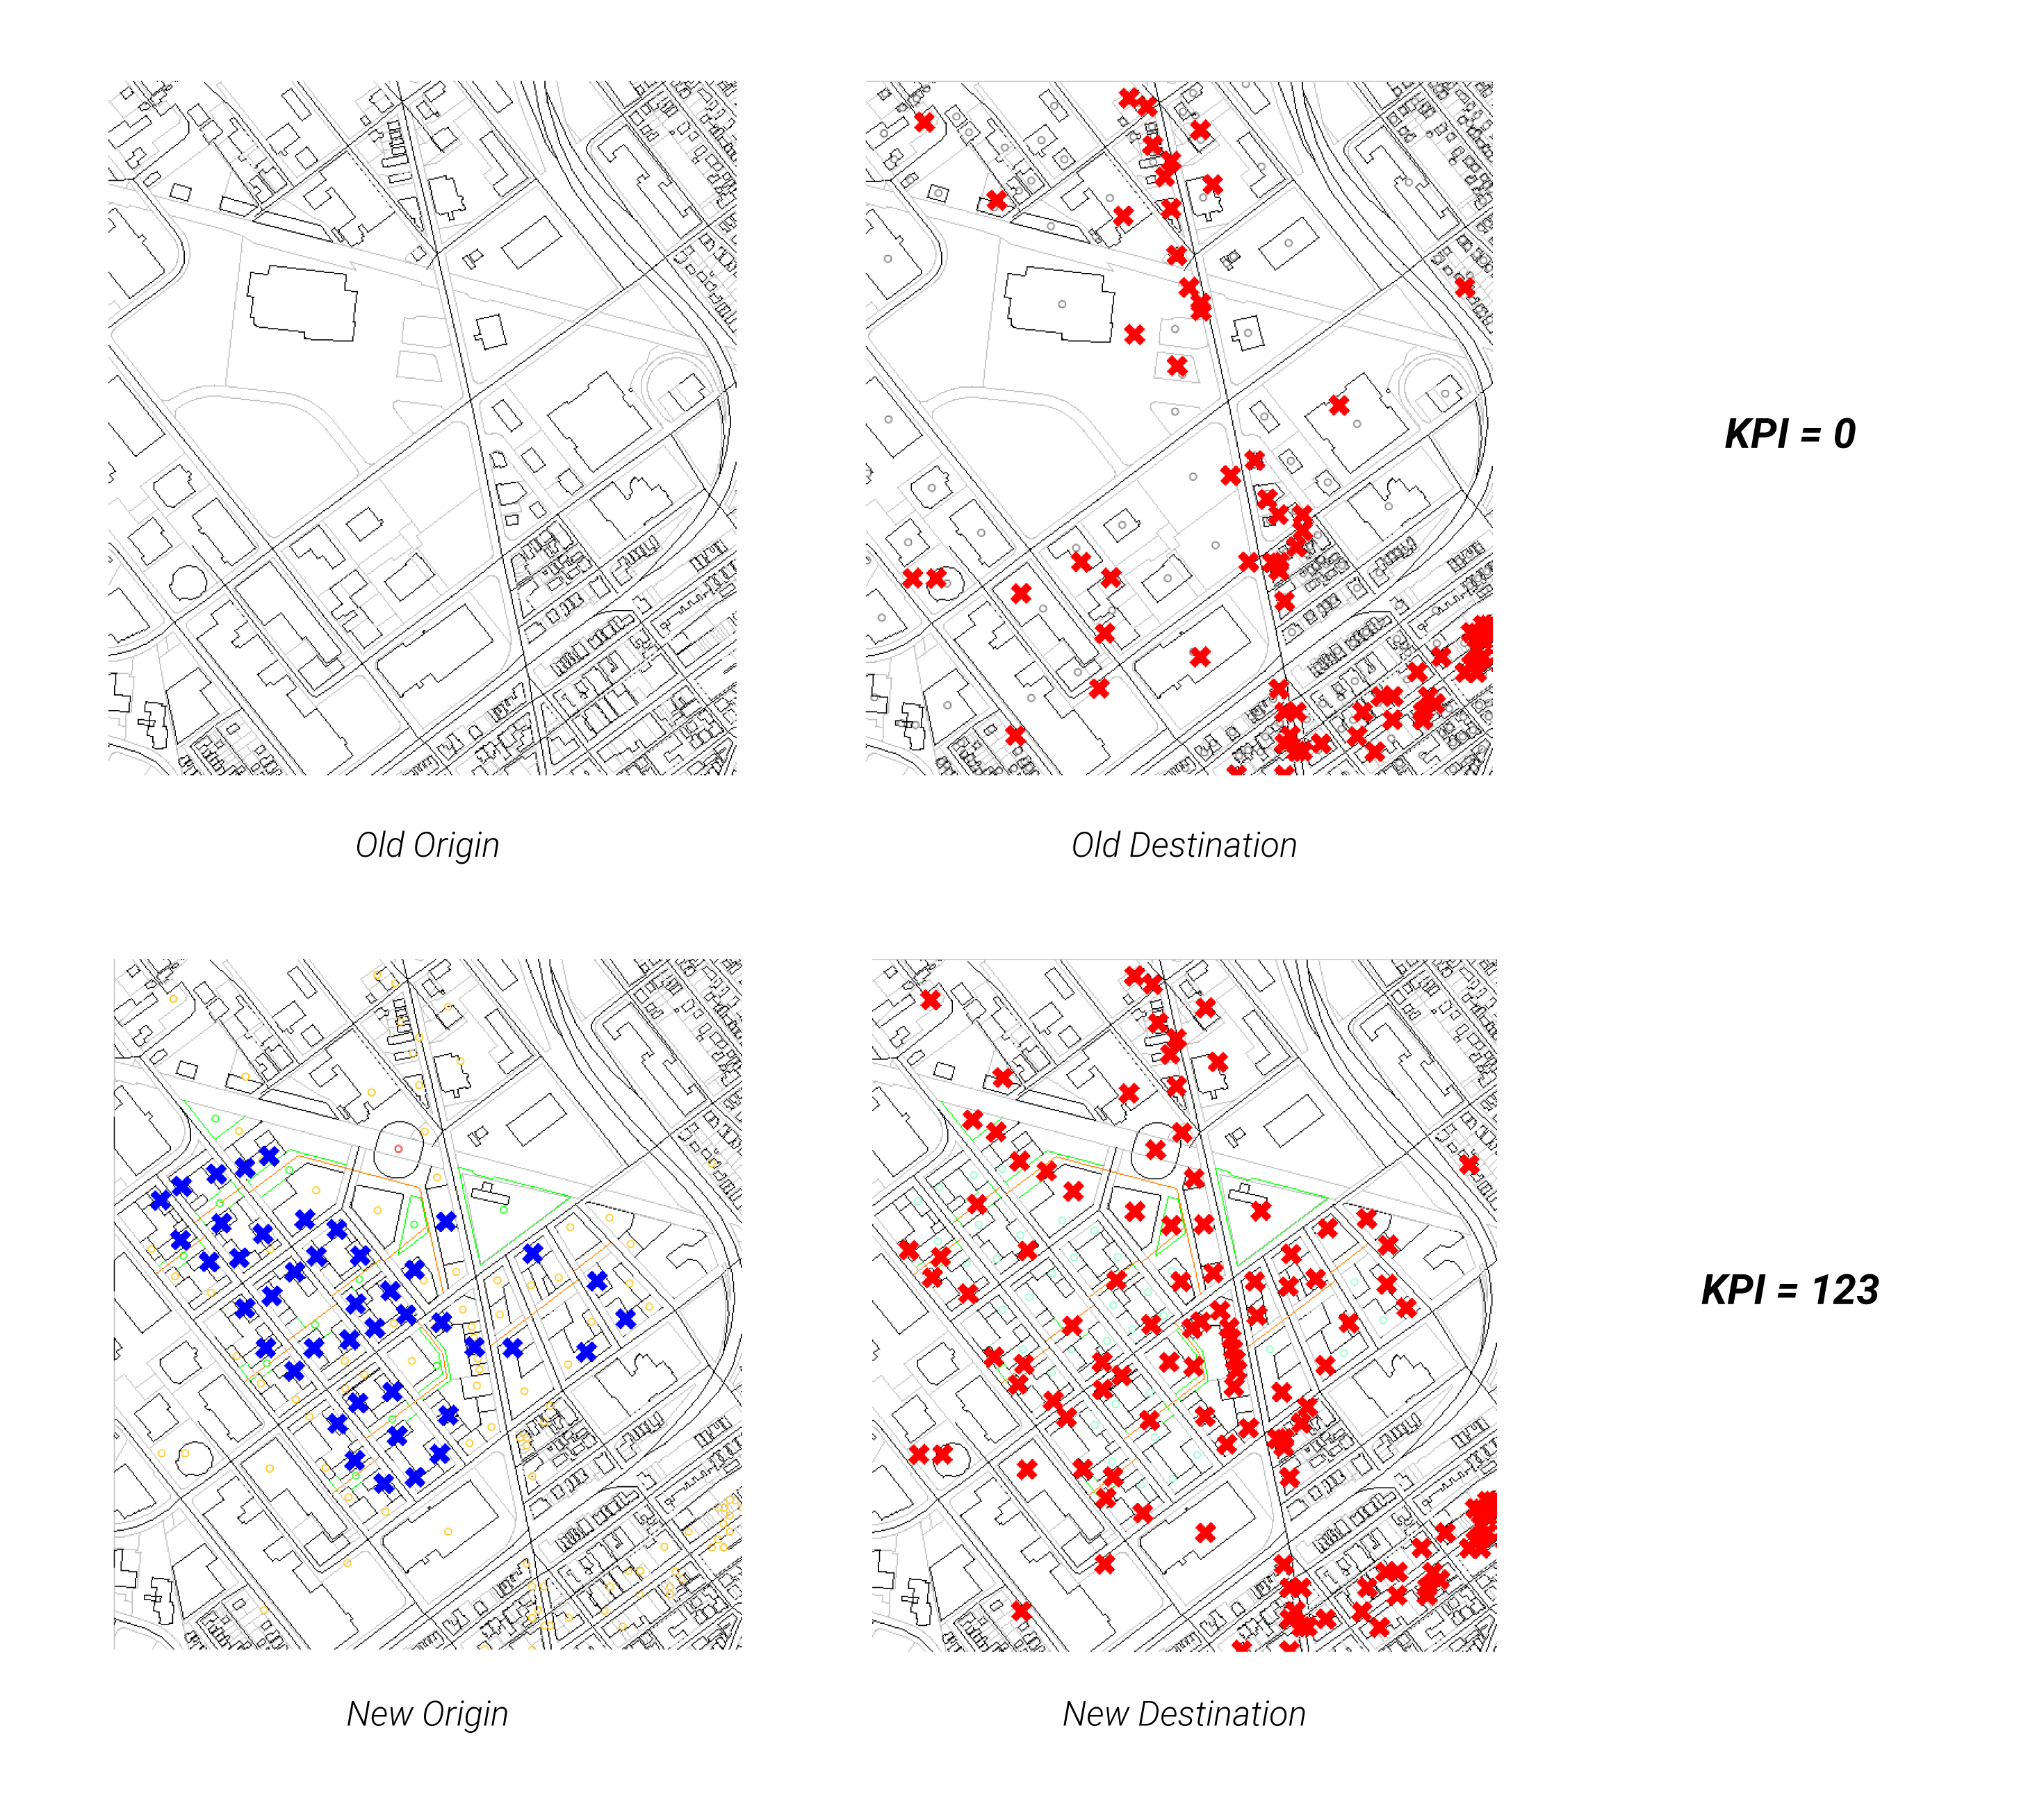
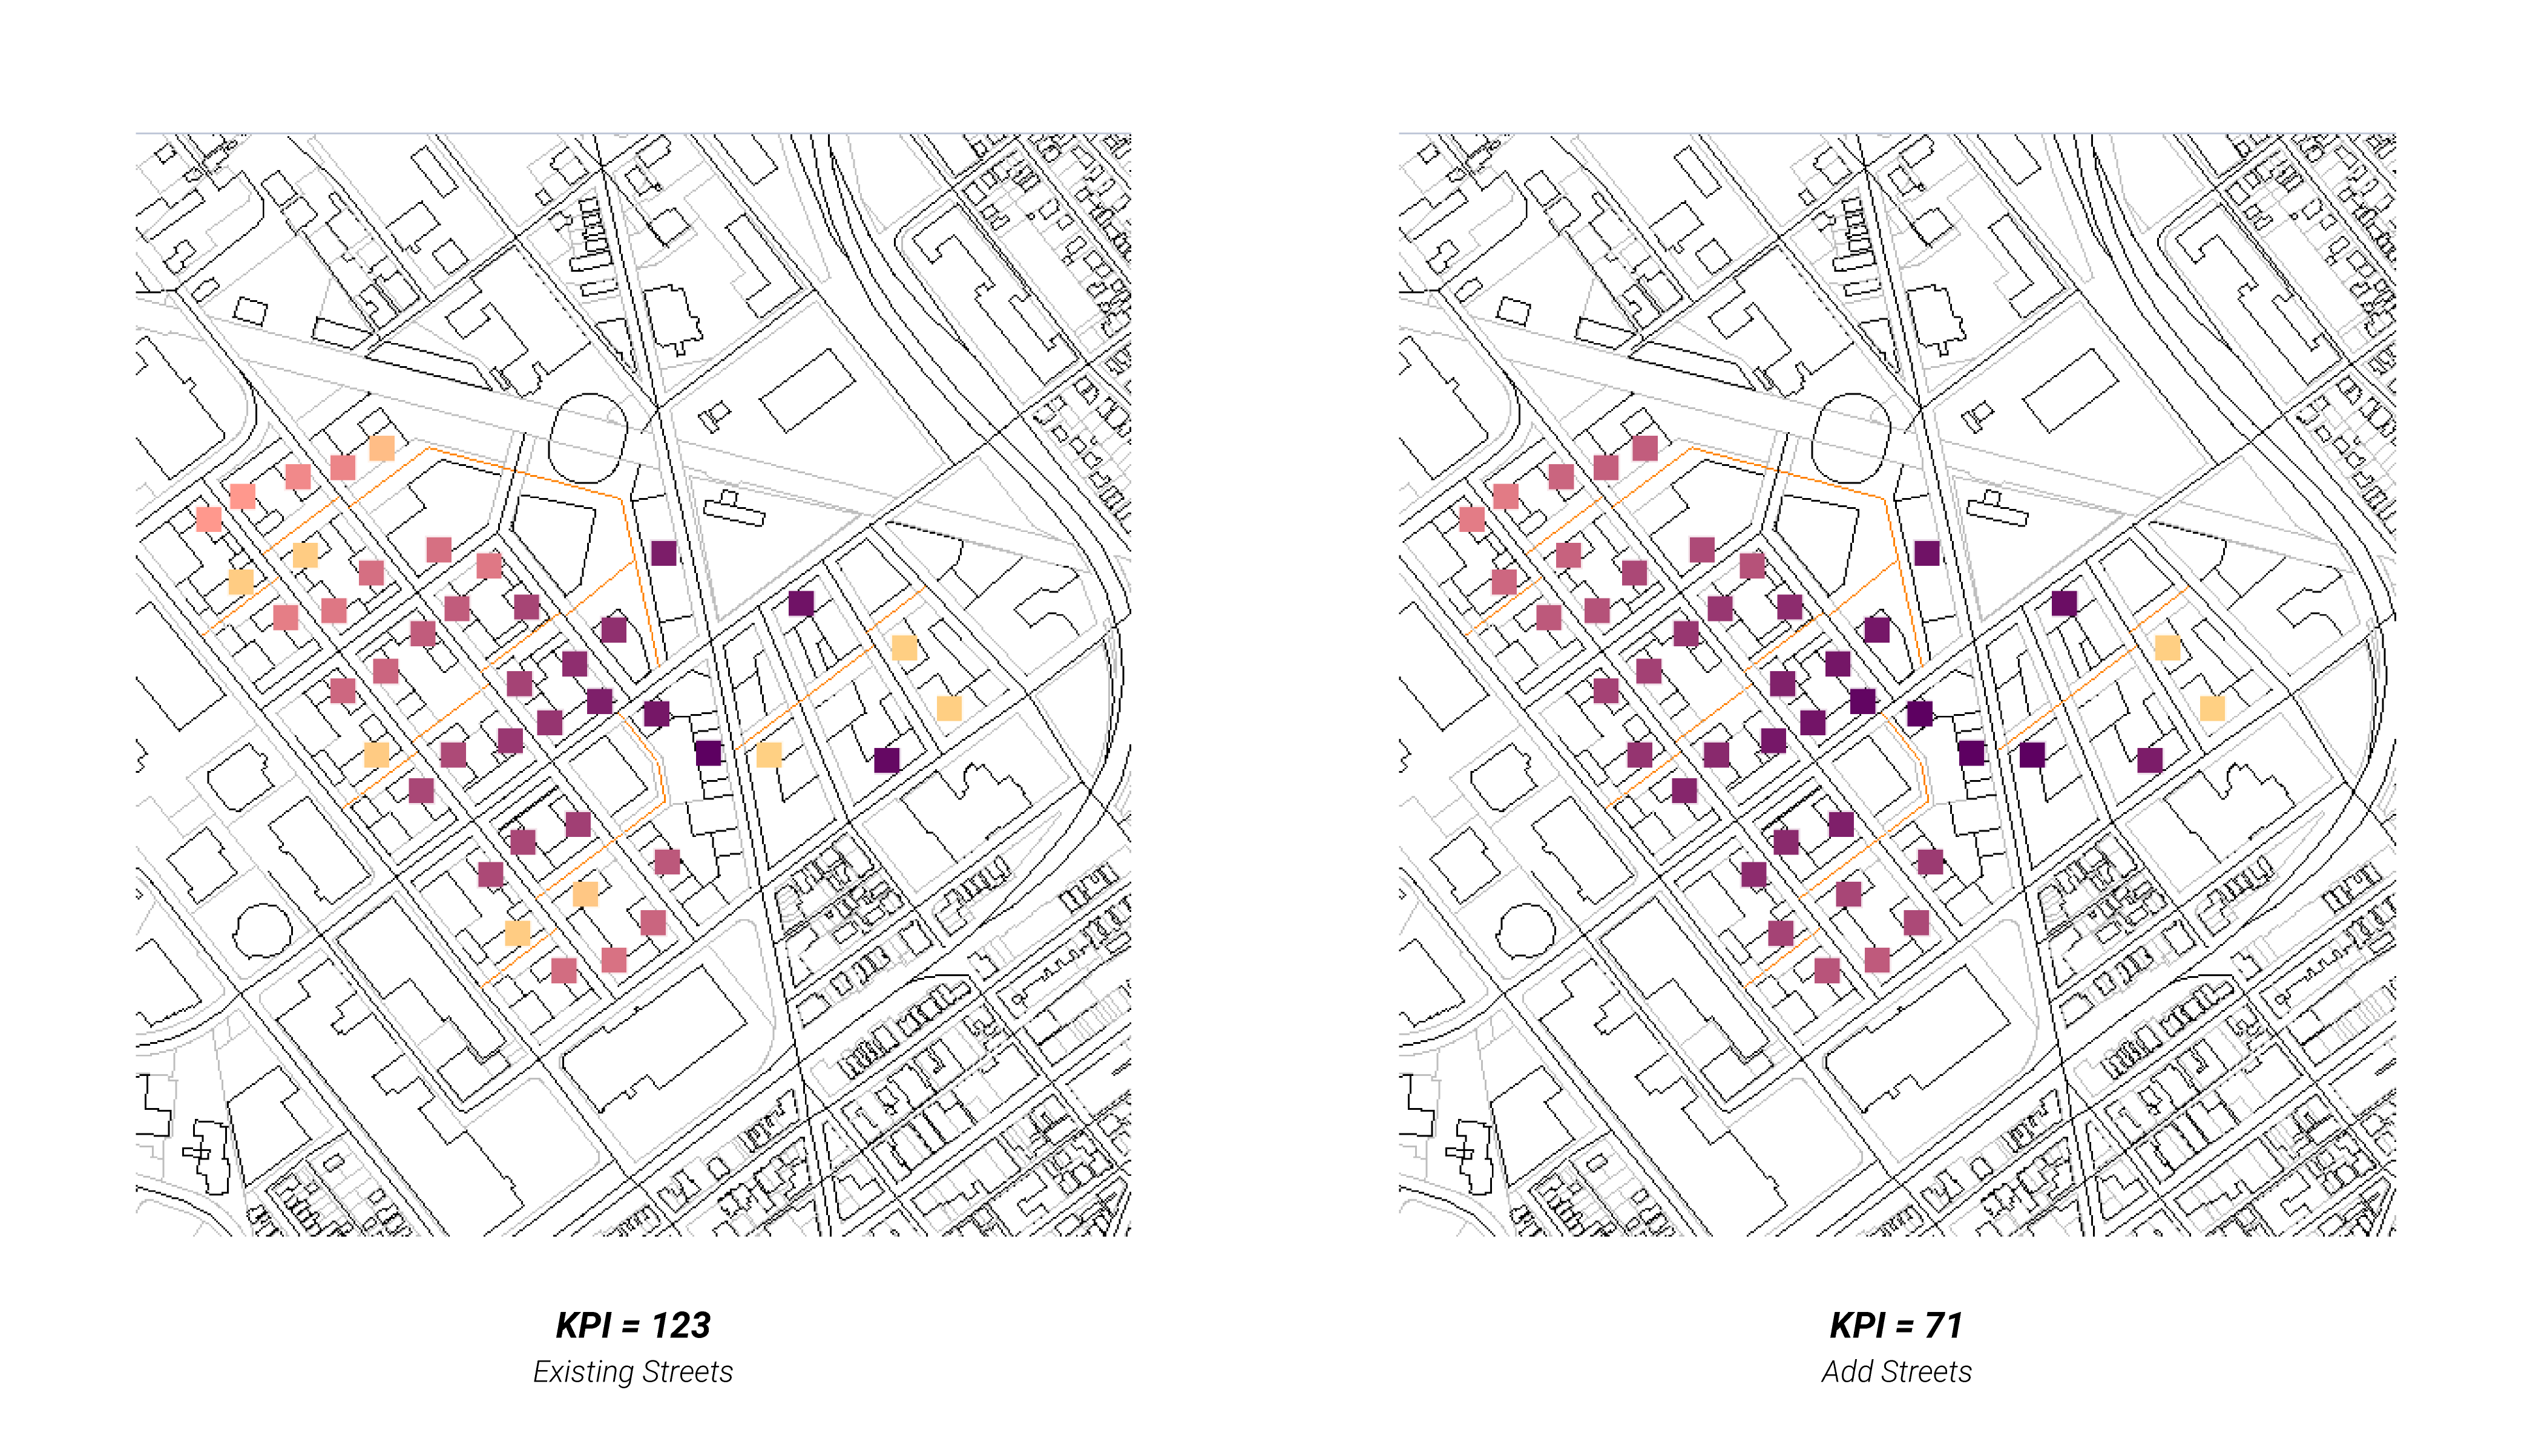
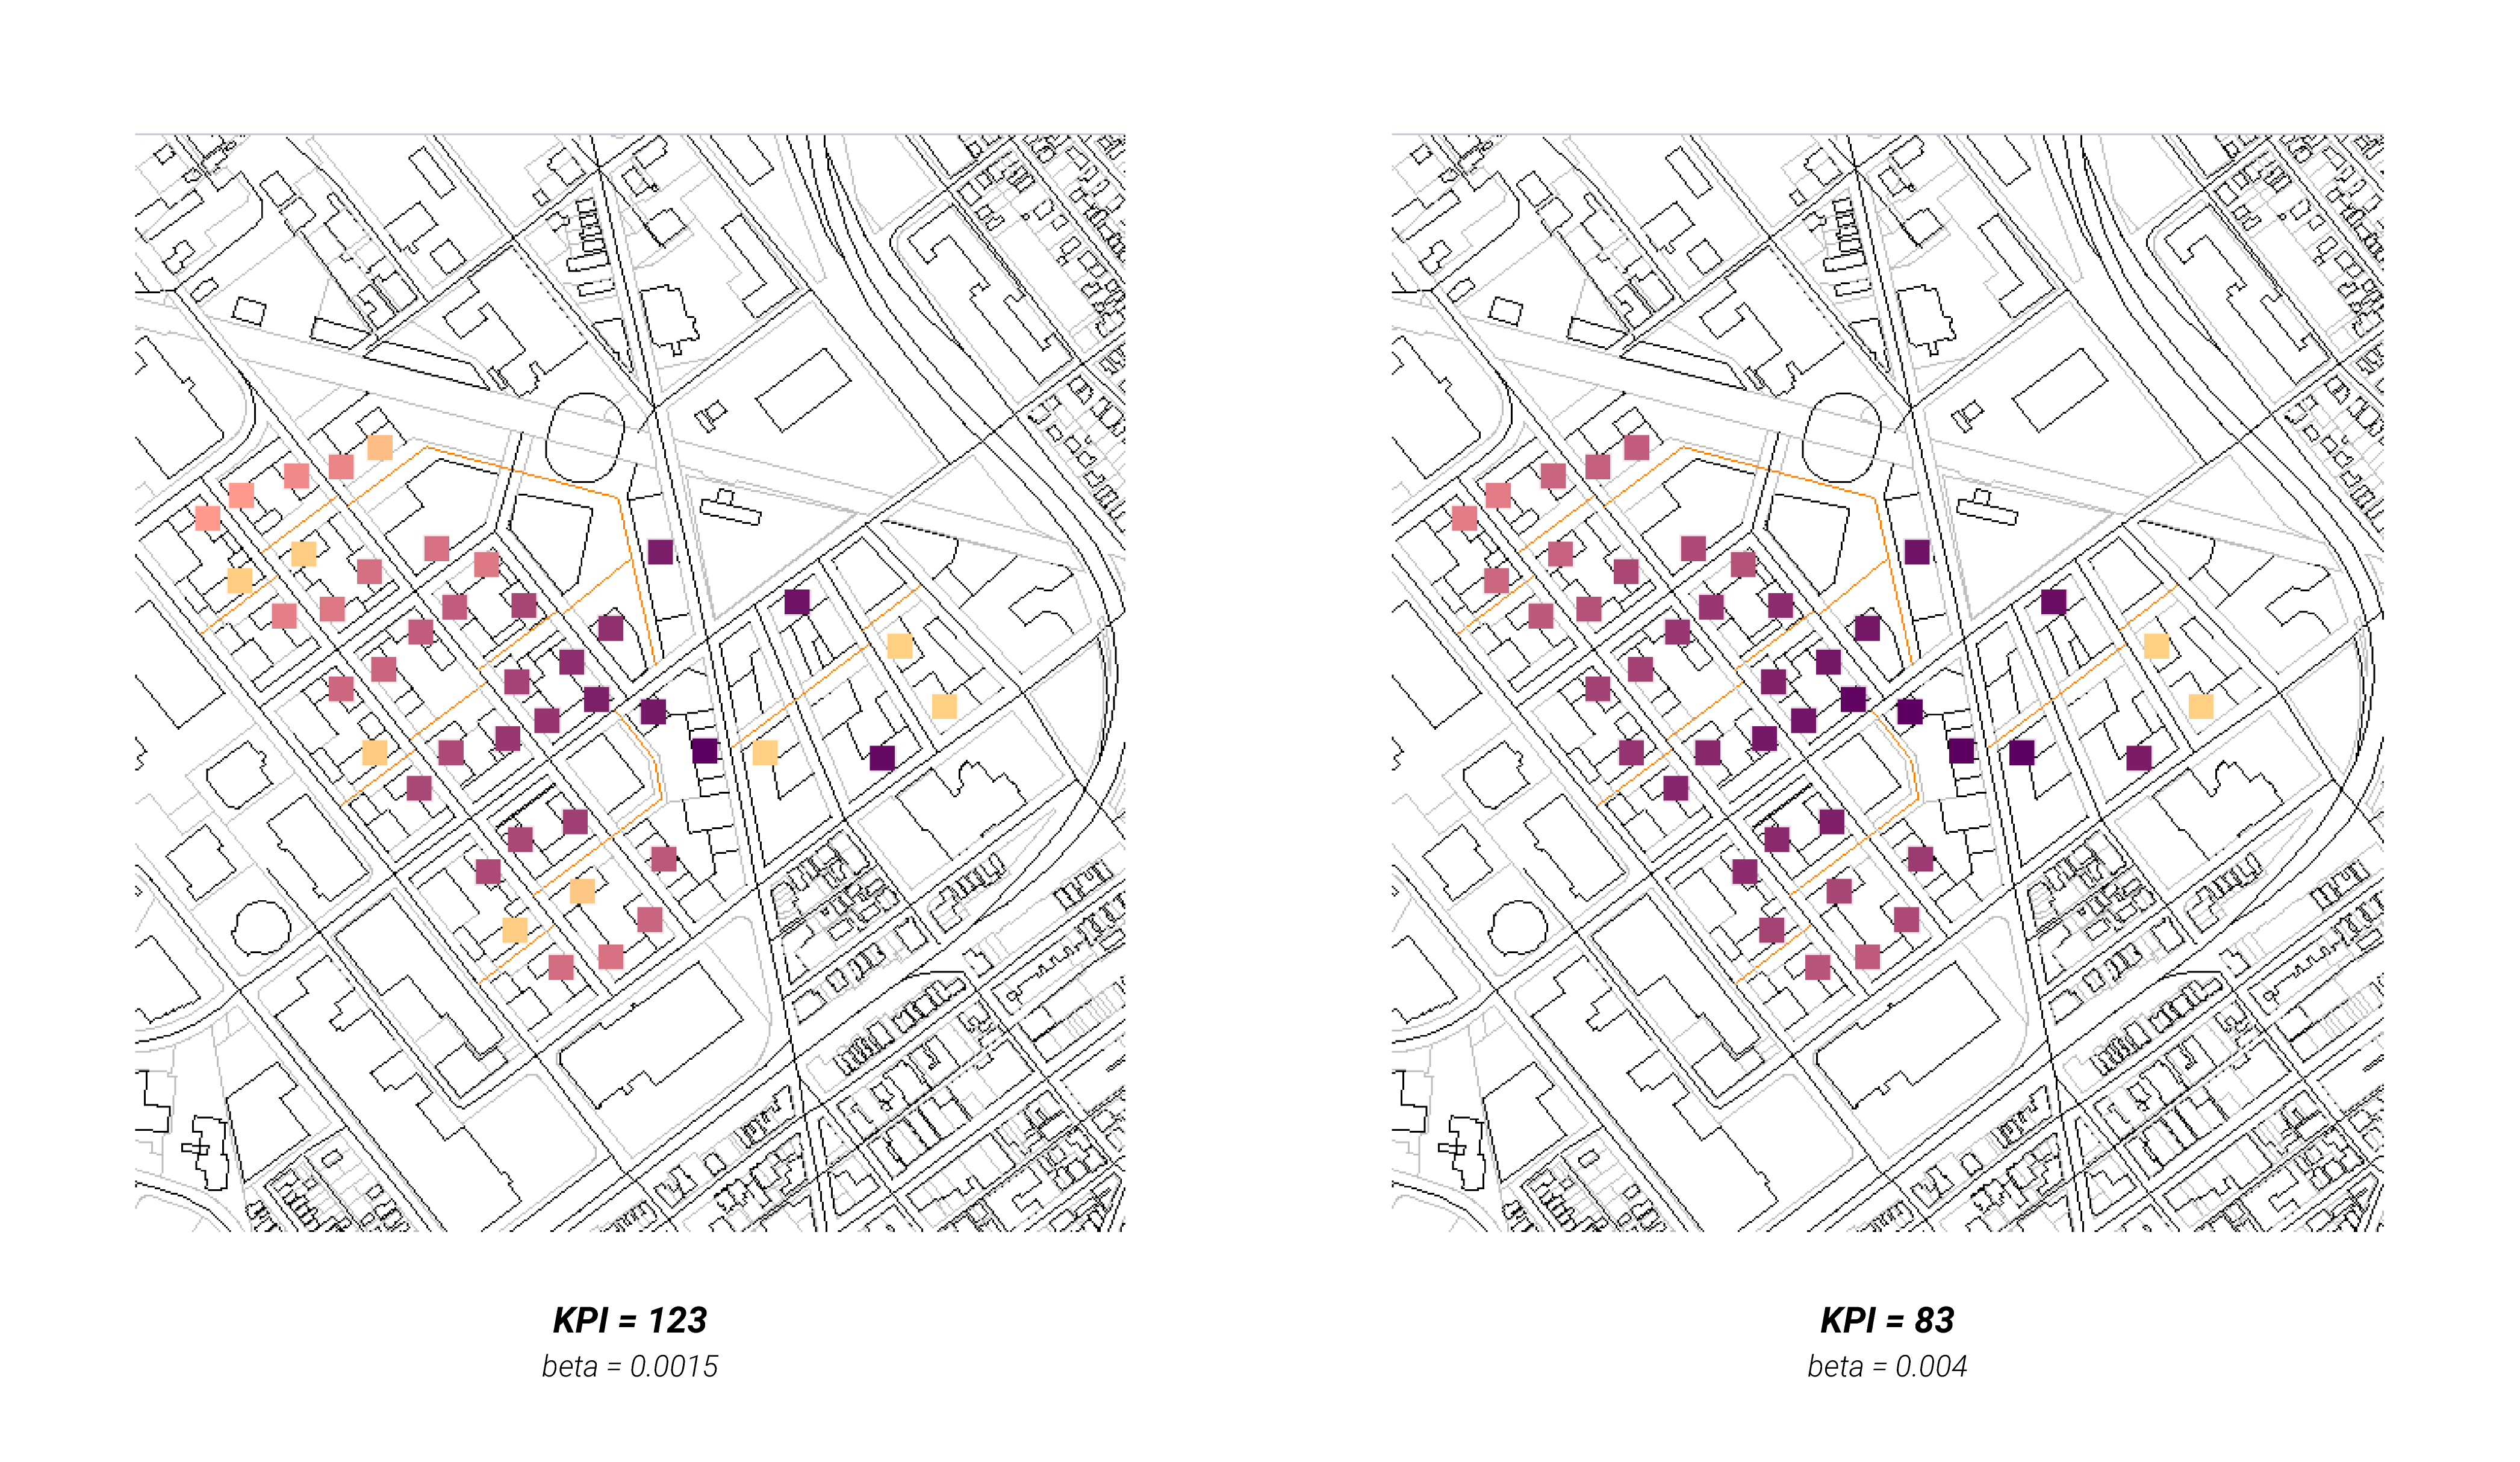
To better show the influence of interventions on the KPI, tests below all used residential buildings in the proposed intervention area as origins.
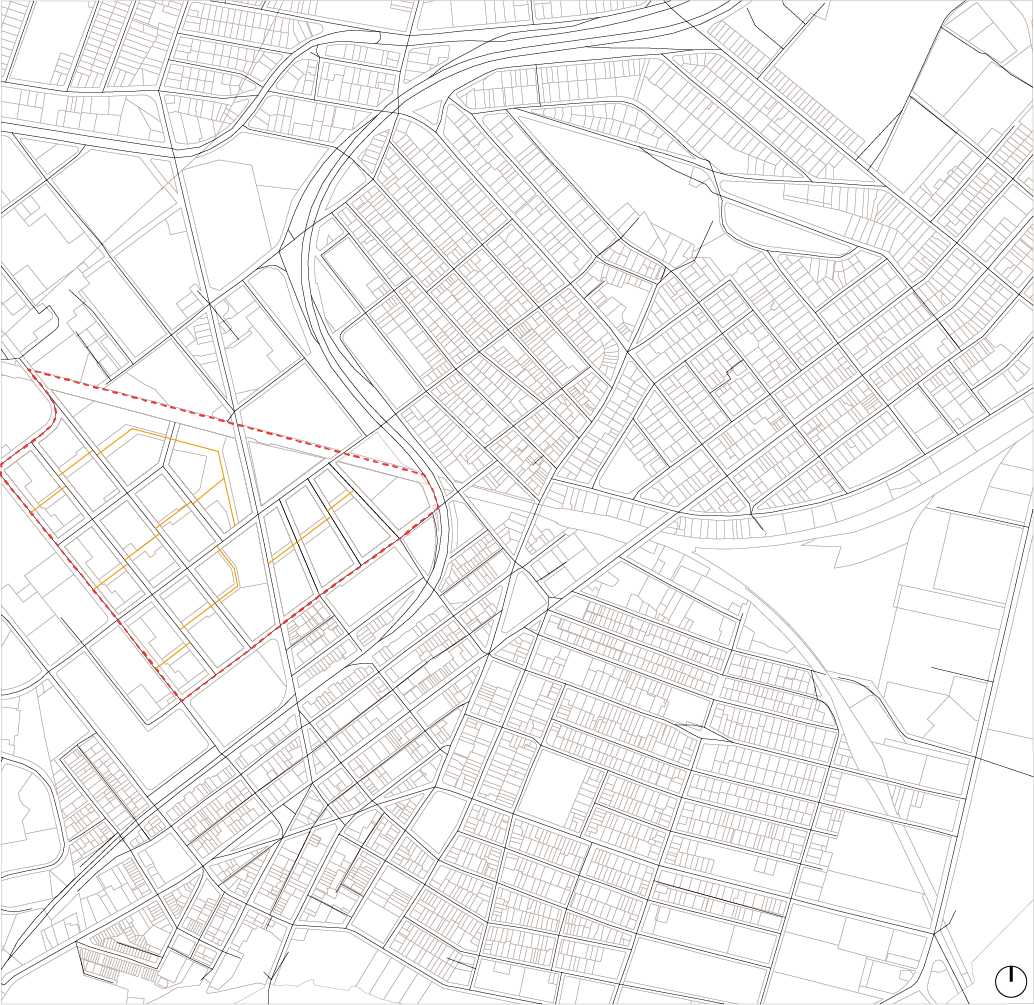
- Add target destinations: (compare the existing condition with Proposal 3 for Chelsea)
- Add pedestrian streets in proposed area: (not working well)
- Change coefficient in the formula:
Discussions
Trade-off
The Walkability KPI emphasizes the proximity between residential buildings and target destinations (i.e. transit stops, parks, grocery, restaurant, etc.), especially commuter rail stations with an importance weight of 10. Thus one potential outcome of maximizing Walkability KPI would be high density development close to commuter rail stations. This effect will be contradictory to those KPIs that care more about consistency of fabric, balance of public and private area and visual aesthetics of street views, i.e. Contextual Fit**, Public-Private Gradient, ChronoForm and Viewshed Connectivity.
For other KPIs related to transit, no opposition has been seen currently.
Future Work
- The current destinations in proposed interventions are not assigned with considerations of economic viability. Future investigations on how to generate viable destinations for a urban design proposal would be in urgent need.
- Careful calibration of street quality calculation is also necessary. Currently, although a will not significantly affect the index, more tests are needed in order to reflect the real effects of street quality change.